Polkadot Bears Are Back, Can DOT Revisit $7 Soon?
April 20, 2023The Polkadot price had been recovering in the past few days, but it has been unable to sustain the momentum as the bulls’ progress has been halted at press time. Over the last 24 hours, the coin experienced a dip of 2%, which has also caused a depreciation of almost 1% in the weekly timeframe, erasing most of the weekly gains.
The technical outlook for Polkadot is showing signs of bearish strength building up. It is currently trading below a crucial resistance level. The resistance level must be surpassed for the bulls to experience some relief.

However, the demand and accumulation remain low on the one-day chart, which is a concern. If bears push again, Polkadot could drop straight to its local support level. The broader market’s strength is crucial for Polkadot to regain its lost value.
Unfortunately, with Bitcoin losing steam and falling below $30,000, most altcoins are also experiencing undecided price movements, which puts further pressure on Polkadot’s price recovery. At the time of writing, the market capitalization of DOT has fallen, indicating mounting short-term selling pressure
Polkadot Price Analysis: One-Day Chart
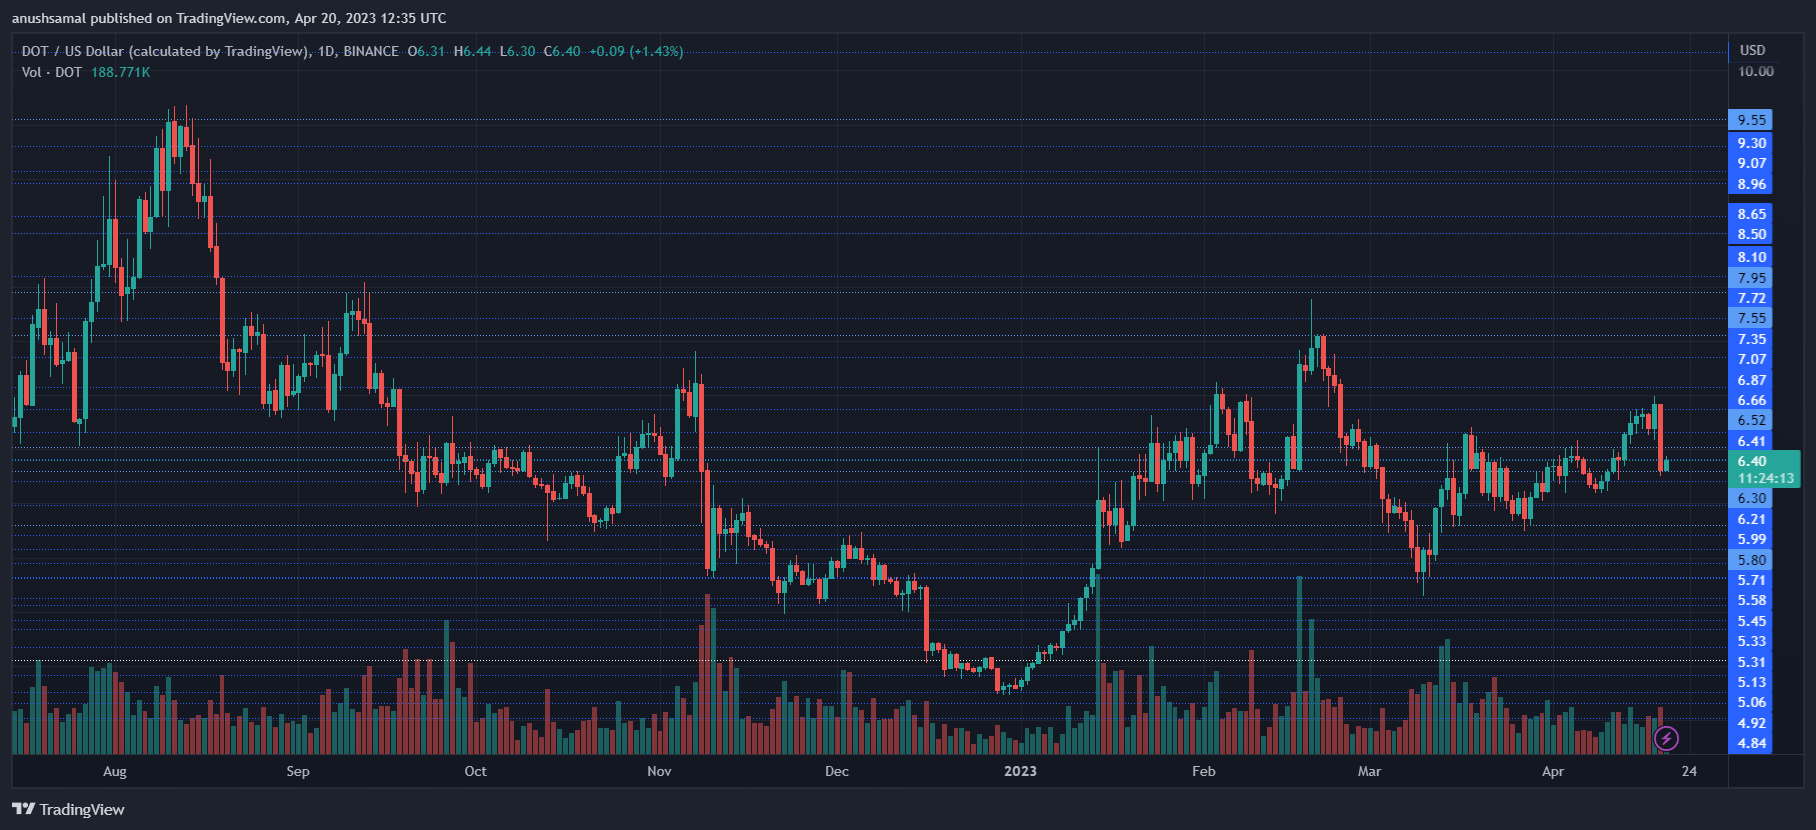
The Polkadot price is trending at $6.40, with overhead resistance at $6.60, a crucial level for the altcoin. This level has previously acted as a bearish block or a selling zone for the coin. If DOT manages to breach the $6.60 price level, it may face another resistance at $6.80 before finally reaching $7.
However, if Polkadot fails to break past the overhead ceiling, the next support levels would be at $6 and then at $5.80, respectively. The amount of DOT traded in the last session was red, indicating a fall in demand for the coin. Overall, the Polkadot price movement depends heavily on its ability to break past the crucial resistance level at $6.60.
Technical Analysis
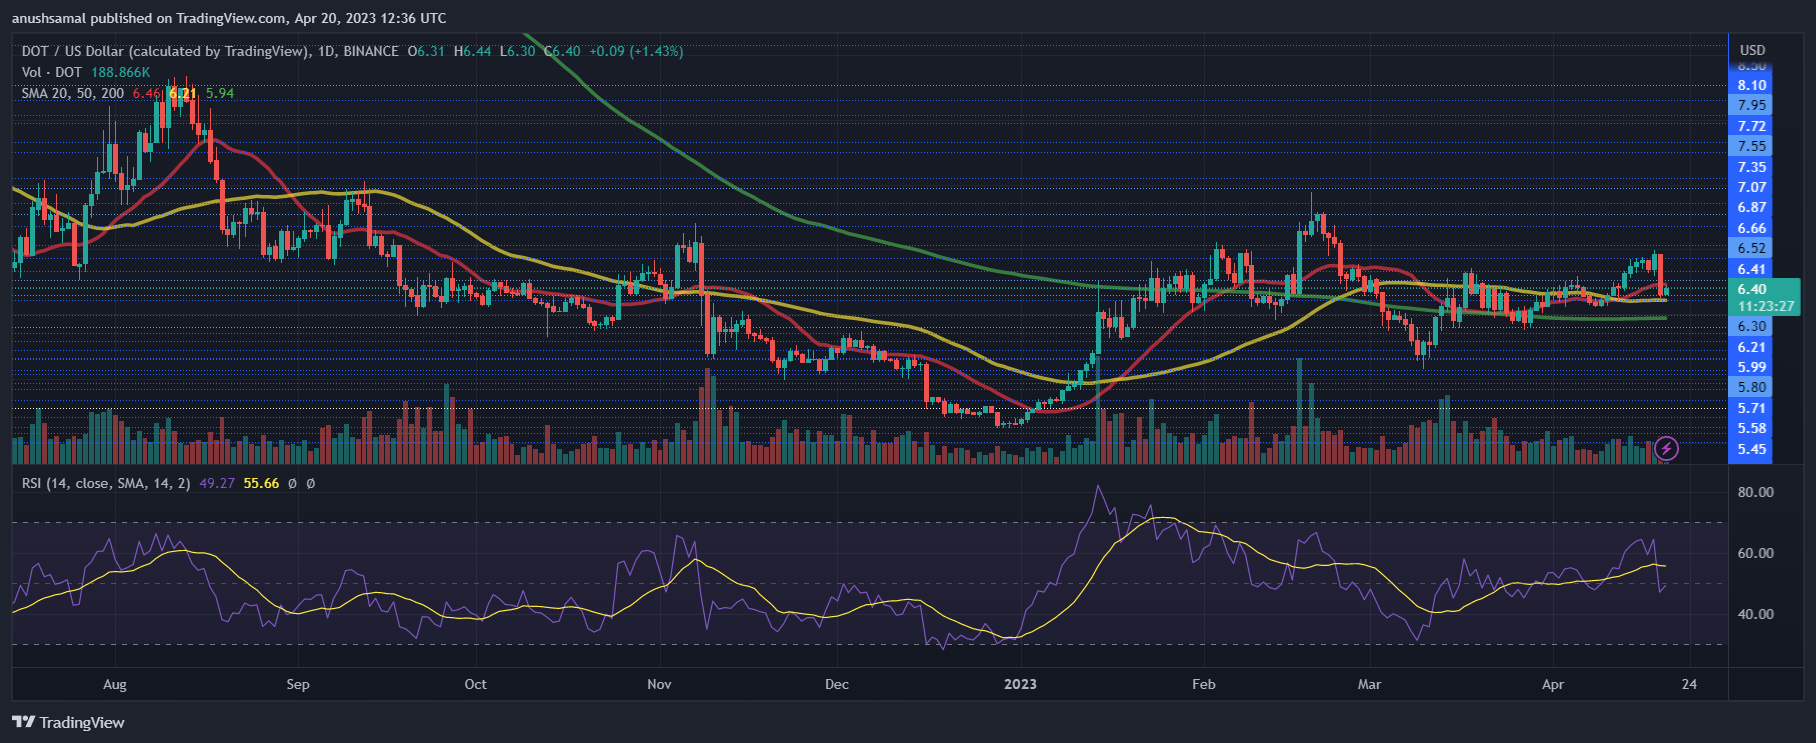
At present, the bears have not gained complete control over the Polkadot price. The Relative Strength Index (RSI) indicates some optimism as it moves closer to the half-line, suggesting that sellers have not outnumbered buyers heavily.
However, DOT is currently trading below the 20-Simple Moving Average line, indicating that sellers are driving the market momentum.
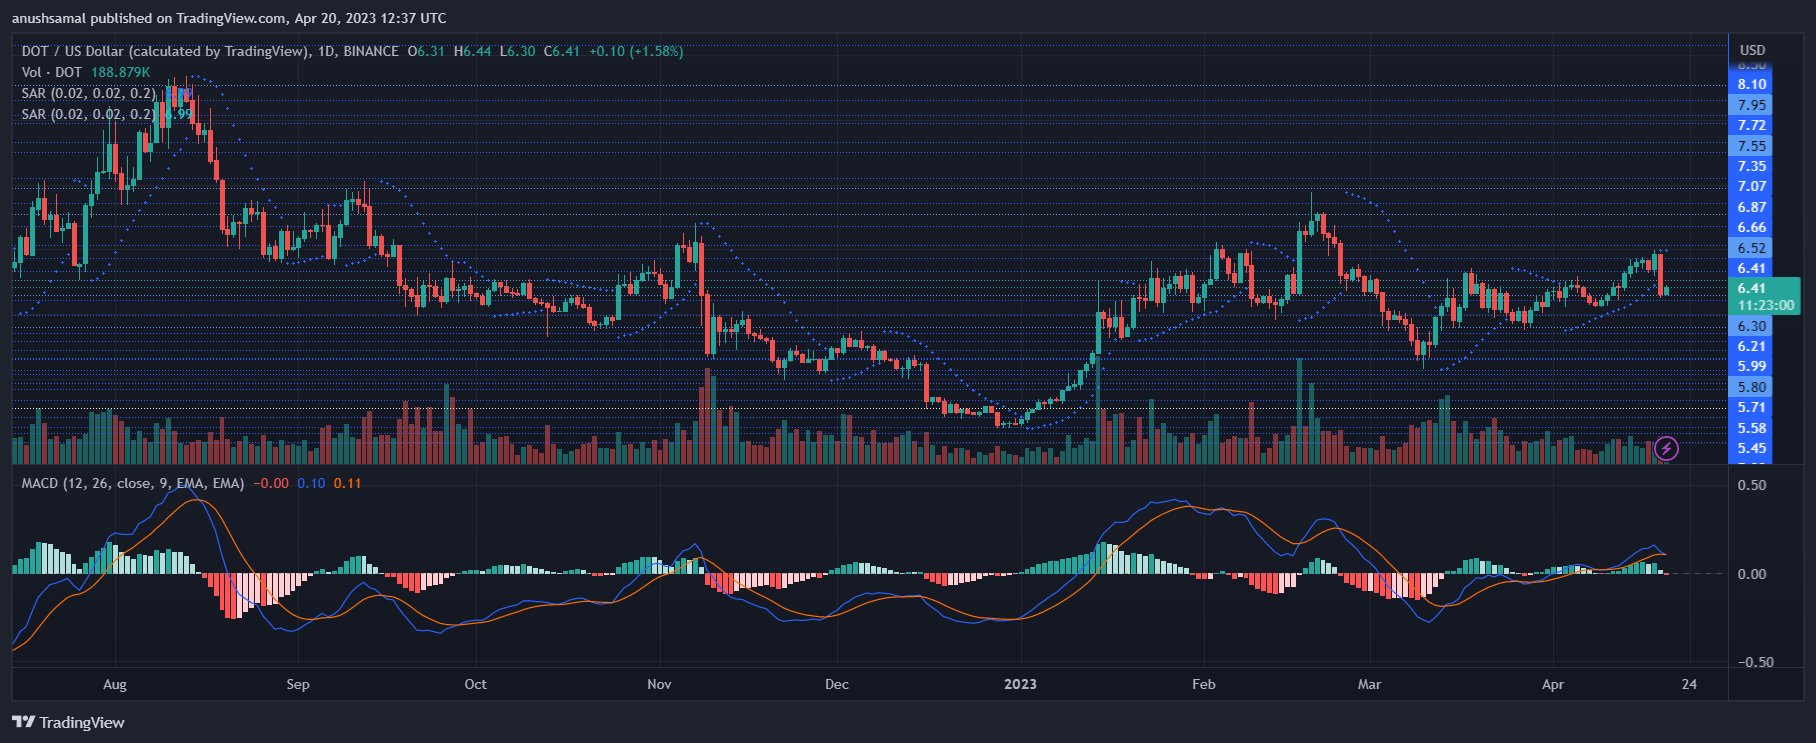
Polkadot’s demand has been decreasing, leading to the formation of a sell signal on the one-day chart. The Moving Average Convergence Divergence (MACD), which measures the price momentum and shift in trend, displayed red histograms associated with sell signals, further indicating a potential downward trend for DOT.
In addition, the Parabolic SAR, which measures the price direction and momentum, displayed dotted lines above the candlesticks. This meant that DOT was showing downward price action at the time of writing, indicating that the sellers are currently in control of the market.
Source: Read Full Article