Ripple Is In The Bearish Trend Zone While Challenging The High At $0.40
January 31, 2023Ripple (XRP) is hitting resistance at $0.43 and moving into the bearish zone.
Long-term forecast for Ripple price: bullish
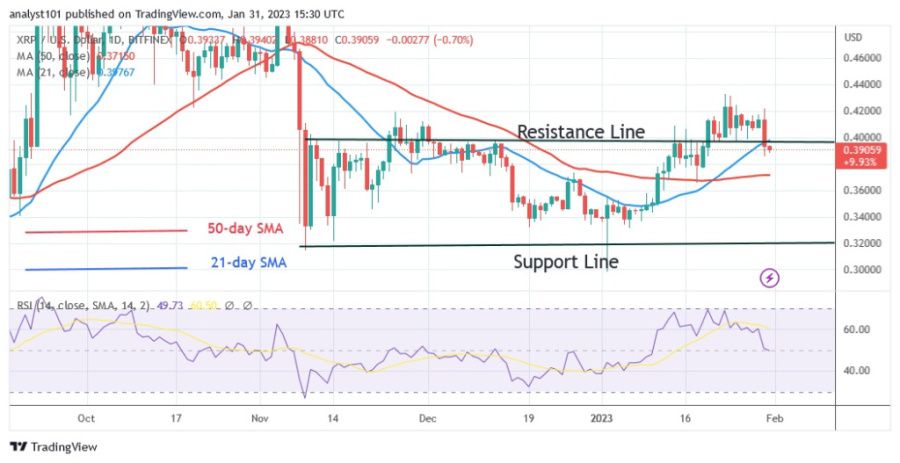
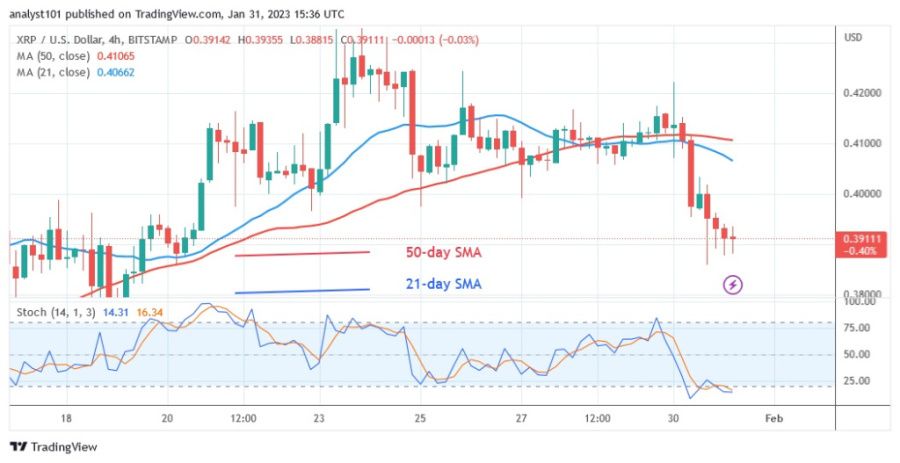
For more than a week, the crypto asset fell but fluctuated below the resistance level of $0.42 and failed to resume an uptrend. When it dropped below the 21-day moving average line but rose above the 50-day moving average line on January 30, the selling pressure remained. The altcoin fell to a low of $0.38 before recovering between the moving average lines. As a result, Ripple has to move within a range for a short period of time. However, XRP will fall to a low of $0.34 if the bears break below the 50-day line SMA. After hitting a low of $0.38, Ripple is currently in an uptrend. If Ripple breaks above the high of $0.40, the positive momentum will resume.
Ripple indicator analysis
XRP is at level 50 on the Relative Strength Index for period 14. Due to the balance between supply and demand, the price of the cryptocurrency asset has reached its equilibrium level. The price bars are currently between the moving averages, which indicates that the cryptocurrency could move in a range. The daily stochastic shows that Ripple is in a positive momentum above 25.
Technical indicators:
Key resistance levels – $0.80 and $1.00
Key support levels – $0.40 and $0.20
What is the next move for Ripple?
With the break below the 21-day moving average line, Ripple is in decline. XRP is currently correcting to the upside. If the price rises above the moving average lines, the uptrend will continue. If it is rejected at the $0.40 high, selling pressure will resume.
Disclaimer. This analysis and forecast are the personal opinions of the author and are not a recommendation to buy or sell cryptocurrency and should not be viewed as an endorsement by CoinIdol. Readers should do their own research before investing
Source: Read Full Article


