Bitcoin Price Trims Losses But Key Breakout Resistance Is Still Intact
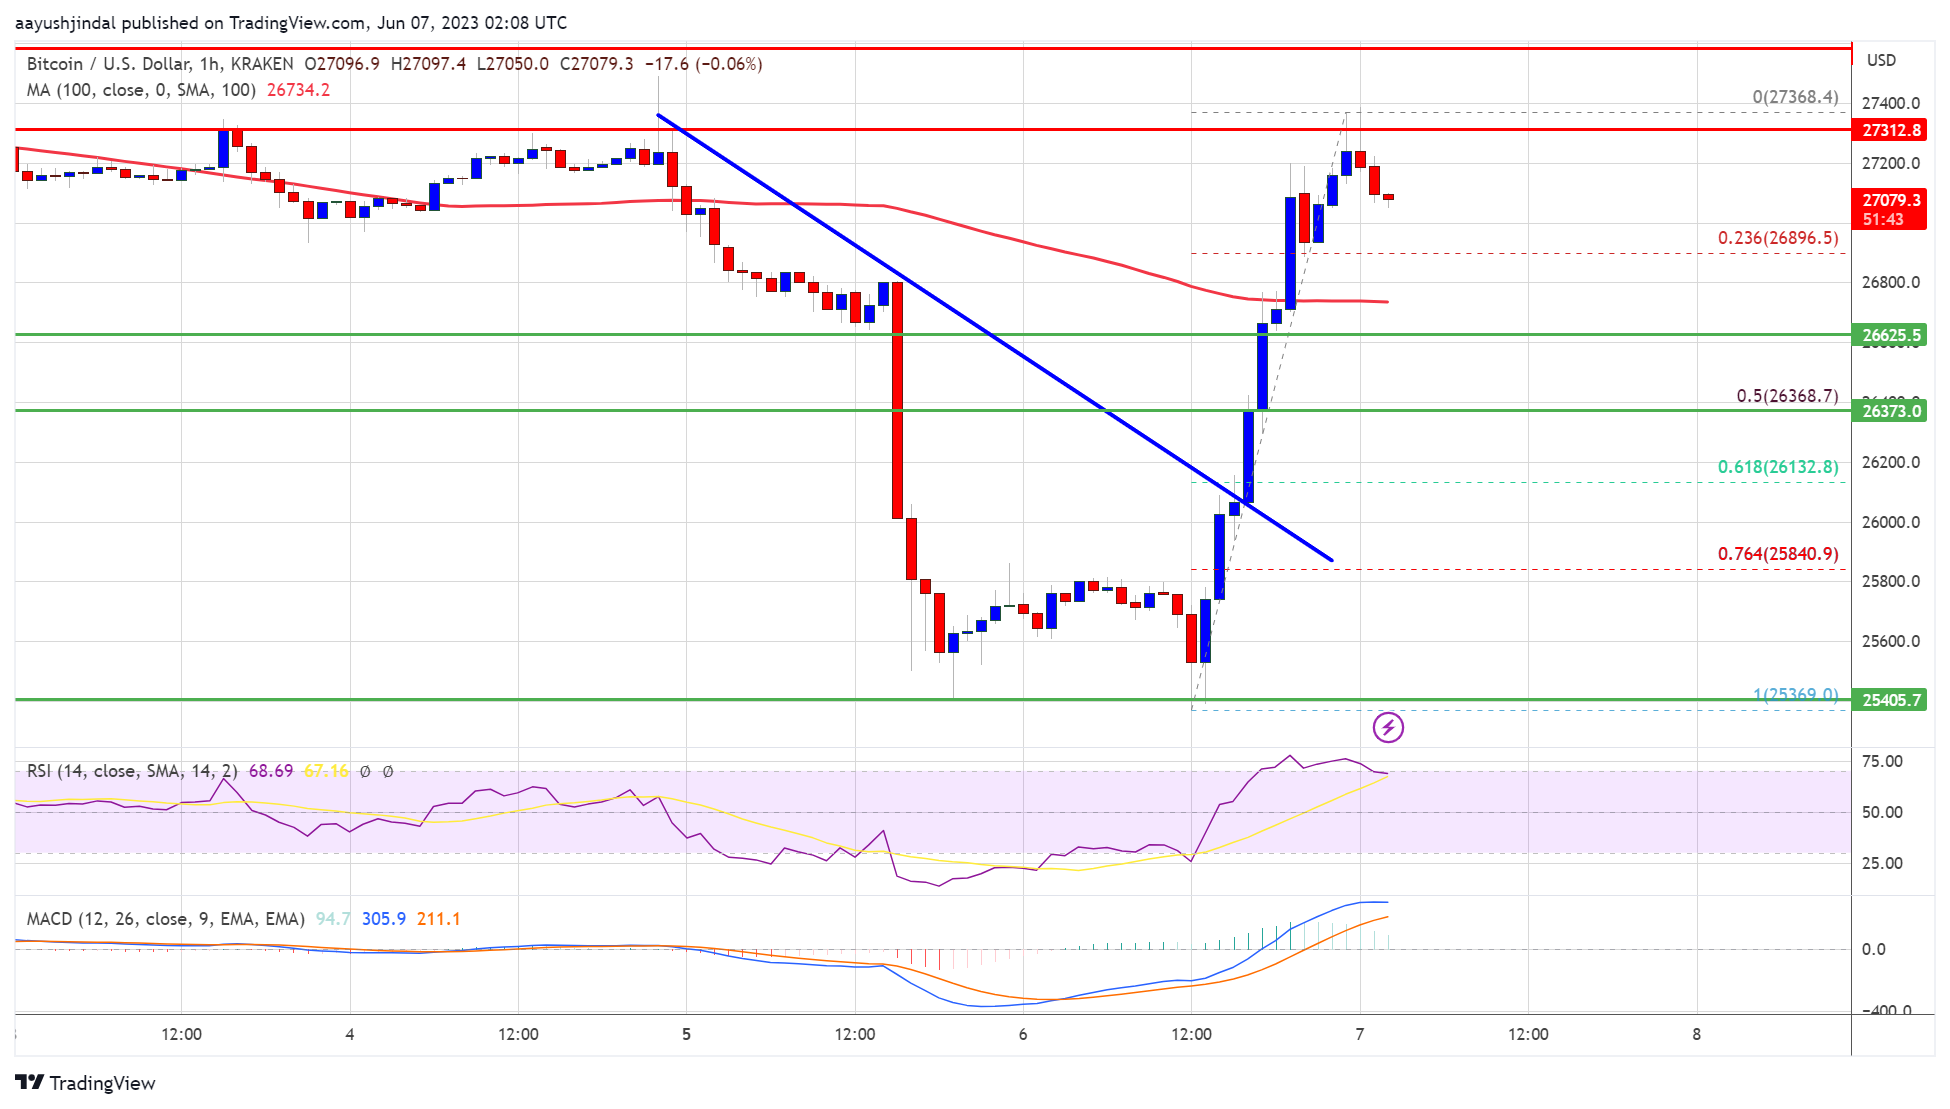
June 7, 2023Bitcoin price trimmed yesterday’s losses and climbed above $26,500. BTC is now again facing strong resistance near the $27,400 zone.
- Bitcoin started a fresh decline after it dived toward the $25,500 support.
- The price is trading above $26,500 and the 100 hourly Simple moving average.
- There was a break above a connecting bearish trend line with resistance near $26,000 on the hourly chart of the BTC/USD pair (data feed from Kraken).
- The pair is now facing a major hurdle near the $27,400 and $27,500 levels.
Bitcoin Price Revisits $27,500
Bitcoin price found support near the $25,400 zone after a major decline. BTC formed a base and was able to start a recovery wave above the $26,000 level.

There was a break above a connecting bearish trend line with resistance near $26,000 on the hourly chart of the BTC/USD pair. The pair was able to clear the $27,000 resistance to move into a positive zone. However, the bears were again active near the $27,400 and $27,500 levels.
A high is formed near $27,368 and the price is now consolidating gains. It is trading above the 23.6% Fib retracement level of the recent increase from the $25,369 swing low to the $27,368 high.
Bitcoin price is trading above $26,500 and the 100 hourly Simple moving average. Immediate resistance is near the $27,400 level. The next major resistance is near the $27,500 level. A close above $27,500 might send the price further higher.
Source: BTCUSD on TradingView.com
The next key resistance is near the $28,000 level. An upside break and close above $28,000 could start a decent increase toward $28,500. Any more gains above the $28,500 resistance zone might send the price toward the $29,500 resistance zone.
Fresh Decline in BTC?
If Bitcoin’s price fails to clear the $27,400 resistance, it could start another decline. Immediate support on the downside is near the $26,800 level and the 100 hourly SMA.
The next major support is near the $26,400 zone or the 50% Fib retracement level of the recent increase from the $25,369 swing low to the $27,368 high, below which the price might regain bearish momentum. In the stated case, the price could drop toward the $26,000 support.
Technical indicators:
Hourly MACD – The MACD is now gaining pace in the bullish zone.
Hourly RSI (Relative Strength Index) – The RSI for BTC/USD is above the 50 level.
Major Support Levels – $26,400, followed by $26,000.
Major Resistance Levels – $27,400, $27,500, and $28,500.
Source: Read Full Article